Altitude vs. Elevation
Garmin have renamed this page from Elevation Plot to Altimeter:- The only Altimeter related functions provided by the GPSMAP 66 are limited to these data fields:
- All remaining
Altimeter page features are directly related to:
- Elevation
- Ambient Pressure
- Barometric Pressure
- See
Altitude vs. Elevation for additional information.
The GPSMAP 66 is designed for recreational navigation purposes and is not intended for activities requiring precise measurements. When calibrated properly, the GPSMAP 66 can report elevation values between -2,000 and 30,000 feet with +/-50 foot accuracy. The accuracy of the elevation values displayed and/or recorded can and will be affected by multiple factors:
- Changes in Weather or Air Pressure
- Fluctuations in weather produce the most significant changes in air pressure.
- For example, when a storm is approaching, the sudden drop in air pressure may simulate the effects of moving to a higher elevation.
- Similarly, changes in air pressure occur when moving from indoors to outdoors and vice versa, particularly when moving in and out of climate-controlled buildings.
- Changes in Ambient Air Temperature
- Since barometric altimeters are not temperature-compensated, changes in ambient air temperature can affect altimeter accuracy.
- When significant changes in ambient temperature are experienced, the altimeter must be recalibrated to restore accuracy.
- Calibration Method
- For greatest accuracy, calibration should be performed using a known elevation, such as a Benchmark.
- Calibration by GPS alone cannot guarantee accuracy within +/-50 feet.
- A clear view of the sky is essential to obtaining the most accurate GPS based elevation possible.
While Garmin may have chosen to label this application 'Altimeter', it is actually capable of plotting several useful data parameters, and could have just as easily been named 'Data Plot'. The Altimeter page can be used to review the elevation profile of saved activities and tracks as well as the currently active tracklog, to calculate the elevation plot of the path ahead to your current destination, or to review ambient and barometric pressure trends to help predict weather conditions!
- Accent colors are displayed using the day/night colors selected in [Setup > Display > Appearance].
- Data values are displayed using the measurement values selected in [Setup > Units].
- Read this GPSVisualizer tutorial on Calculating Elevation Gain, and refine your recorded elevation data as desired.
- View and access Altimeter information remotely with the Altimeter dashboard.
Data Plot Types
- Elevation/Time: Plots the elevation profile for the selected tracklog over time traveled.
- Elevation/Distance: Plots the elevation profile for the selected tracklog over distance traveled.
- Barometric Pressure/Time: Plots barometric pressure calculation over time recorded.
- Ambient Pressure/Time: Plots ambient pressure readings over time recorded.
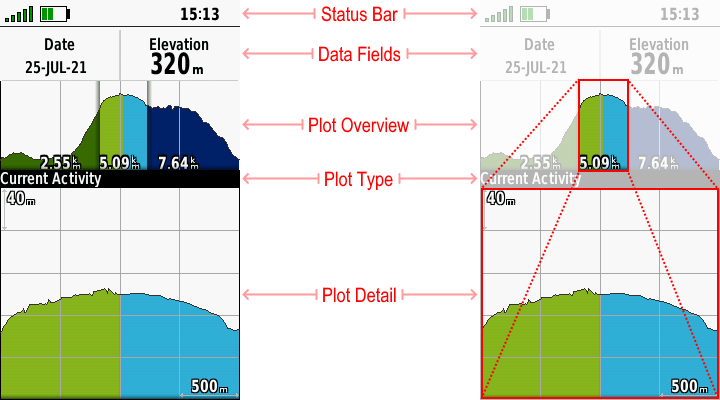
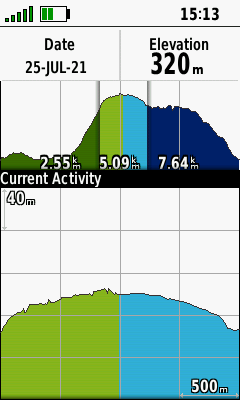
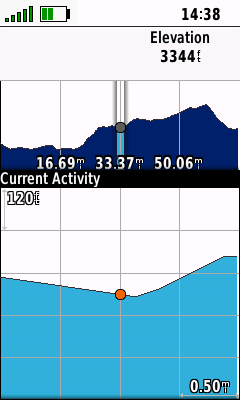
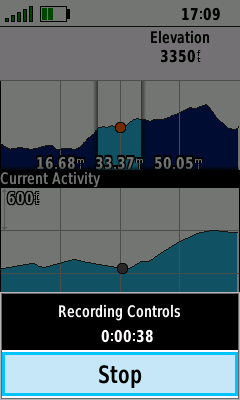
Display Fields
- The Data Plot Display consist of:
- Status Bar: Displays frequently needed system status information.
- Data Fields: Displays two user configurable data fields or date, time and {value} for the selected point in the Data Plot.
- Plot Overview: Displays the complete Data Plot from start to finish.
- Plot Type: Displays the name of the currently displayed Data Plot.
- Plot Detail: Displays the selected portion of the Plot Overview in greater detail.
Data Plot Colors
- Unique Data Plot colors are used to indicate:
- Path Taken: Tracklog created between Start Location and Current Location.
- Current Location: Can also indicate Selected Location when reviewing a Data Plot.
- Path Ahead: Selected route between Current Location and Destination.

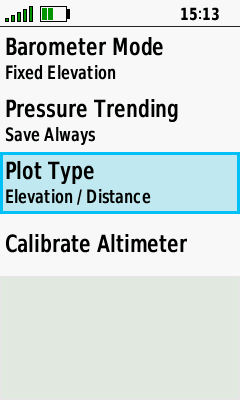
Change Plot Type
- Configure desired data plot type.
 |
 |
 |
 |
|---|---|---|---|
| (Menu) | [Altimeter Setup] | [Plot Type] | Select desired Plot Type |
Change Data Fields
- Configure Altimeter page data fields as desired.
 |
 |
 |
 |
|---|---|---|---|
| (Menu) | [Change Data Fields] | Select Data Field to Change | Choose desired Category |
 |
 |
||
| Choose desired Data Field | New Data Field is Displayed |
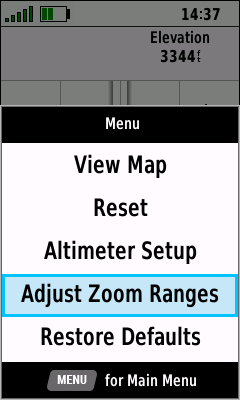
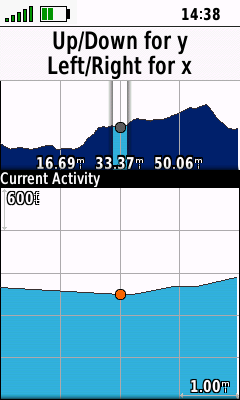
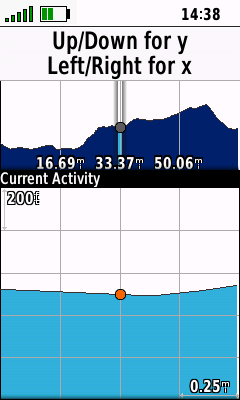
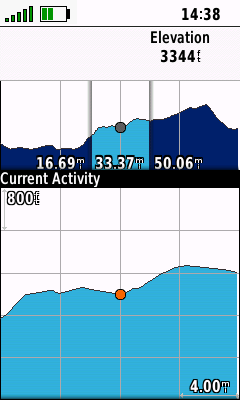
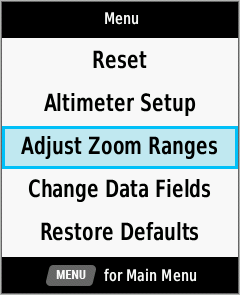
Change Plot Scale
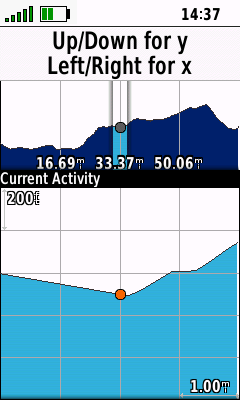
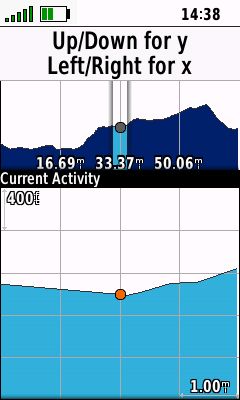
- Vertical Scale (Y Axis): Press D-PAD Up / Down to adjust scale as desired.
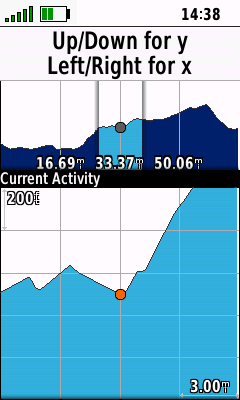
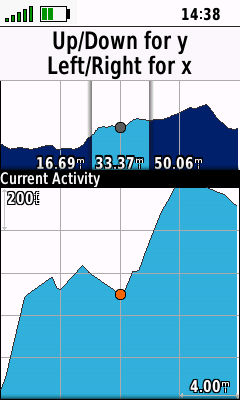
- Horizontal Scale (X Axis): Press D-PAD Left / Right to adjust scale as desired.
- Both Scales (X+Y Axis): Use (+) / (-) buttons to adjust both scales simultaneously as desired.
 |
 |
 |
|
|---|---|---|---|
| (Menu) | [Adjust Zoom Ranges] | Adjust X+Y Axis as desired | |
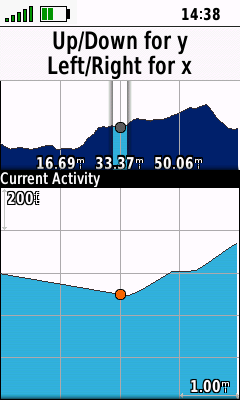
| Vertical Scale (Y Axis): Press D-PAD Up to increase vertical scale value (Zoom Out) as desired. | |||
 |
 |
 |
 |
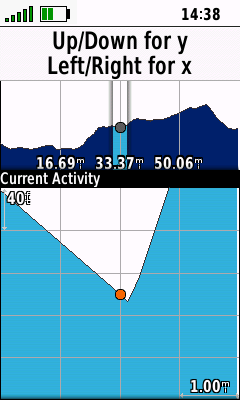
| Vertical Scale (Y Axis): Press D-PAD Down to decrease vertical scale value (Zoom In) as desired. | |||
 |
 |
 |
 |
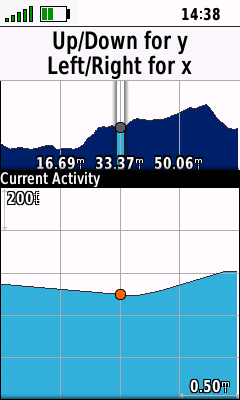
| Horizontal Scale (X Axis): Press D-PAD Left to decrease horizontal scale value (Zoom In) as desired. | |||
 |
 |
 |
 |
| Horizontal Scale (X Axis): Press D-PAD Right to increase horizontal scale value (Zoom Out) as desired. | |||
 |
 |
 |
 |
| Both Scales (X+Y Axis): Press (+) button to decrease both scale values simultaneously (Zoom In) as desired. | |||
 |
 |
 |
 |
| Both Scales (X+Y Axis): Press (-) button to increase both scale values simultaneously (Zoom Out) as desired. | |||
 |
 |
 |
 |
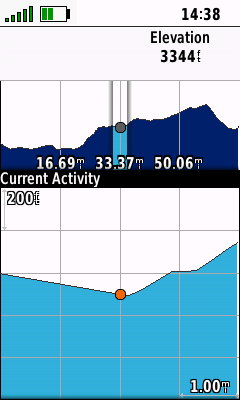
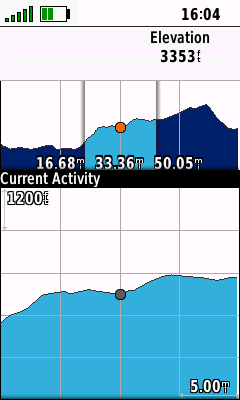
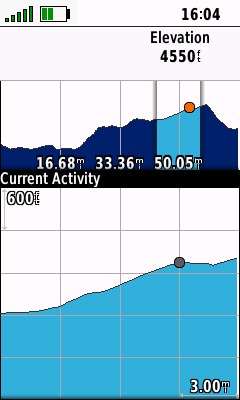
Scroll Data Plot
- Plot Overview: Scroll upper window to quickly select desired portion of Data Plot displayed in lower window.
- Plot Detail: Scroll lower window to examine displayed section of Data Plot in detail.
- Location Marker: Indicates active window and user selected Data Plot location for displayed data.
 |
 |
 |
 |
|---|---|---|---|
| Use D-PAD Up/Down to select Plot Overview Marker |
Use D-PAD Left/Right to quickly scroll to desired plot area |
Use D-PAD Up/Down to select Plot Detail Marker |
Use D-PAD Left/Right to slowly scroll to desired plot location |
View Map
- View selected Data Plot location on map page.
 |
 |
 |
|
|---|---|---|---|
| Place Location Marker | (Menu) > [View Map] | View plot location on map |
Recording Controls
- Press (Enter) to quickly access essential recording controls, and (Quit) to return to the Altimter page.
 |
 |
 |
 |
|---|---|---|---|
| Press (Enter) for direct access to recording controls |
[Start] a new Activity Recording |
[Stop] the current Activity Recording |
Manage the current Activity Recording |
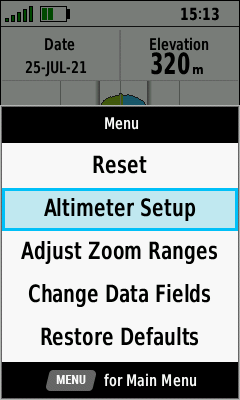
Option Menu
- Press (Menu) button to view available options.
 |
 |
 |
 |
|---|---|---|---|
| [View Map] | [Reset] | [Altimeter Setup] | [Adjust Zoom Ranges] |
 |
 |
||
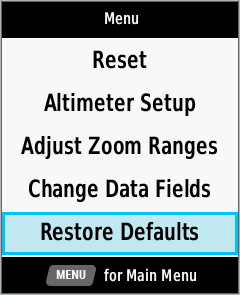
| [Change Data Fields] | [Restore Defaults] |
Weather Station
x