How To...
Altimeter
- Auto Calibration
- Barometer Mode
- Pressure Trending
- Plot Type
- Manual Calibration
- Weather Station
- Accuracy
- Altitude vs Elevation
1. Auto Calibration
- Choose when the altimeter is automatically calibrated
- Can be performed only while GPS signals are available (see
Method #4 - Auto
Calibration)
- On (Auto calibration is enabled)
- Off (Auto calibration is disabled)
- Once (Altimeter is calibrated once per power cycle after
satellite signal is available)
- Continuous (Auto calibration is
enabled)
2. Barometer Mode
- Choose a desired barometer mode
- Variable Elevation (Allows the barometer to measure changes in
elevation while you are moving)
- Fixed Elevation (Assumes device is stationary and barometric
pressure changes are only due to weather)
3. Pressure
Trending
- Choose how the device records ambient pressure information
- Save When Power On (records pressure only while the GPSr is powered
on)
- Save Always (wakes the device at 15 minute
intervals to take pressure readings - useful when
watching for pressure fronts)
4. Plot Type
- Elevation / Time (Record elevation changes over a period of time)
- Elevation / Distance (Record elevation changes over a distance)
- Barometric Pressure (Record barometric pressure changes over a
period of time)
- Ambient Pressure (Record ambient pressure changes over a period of
time)
5. Manual
Calibration
- See
Barometric Pressure and
Altimeters
- Provides multiple methods for the user to calibrate the altimeter
using a known value
6. Weather Station
- Use your barometric pressure sensor equipped Garmin GPSr to predict
the weather
- This process requires the GPSr to remain stationary for an extended
period of time (for example, after setting up camp for the evening)
- Tip:
Create a dedicated
'Weather Station'
profile
pre-configured with the necessary settings for quick and easy access:
- Tip: Download and copy the
weather prediction charts for your device to the
[GPSr]\Garmin\JPEG\
or
[microSD]\Garmin\JPEG\
directory, making them available for review in the field using the Photo
Viewer on the GPSr
- After the GPSr has been placed outside and allowed to collect
sufficient barometric pressure data, open the 'Altimeter' or 'Elevation Plot' page:
 |
|
 |
| Barometric Pressure Data Plot |
|
Select any position along data plot to view recorded value |
- Predicting the Weather
- Falling barometer values typically indicate clouding conditions that
may result in rain
- Climbing barometer values indicate the opposite, or clearing
weather conditions
- A barometric pressure variation greater than 0.18"Hg (6mb) in
less than a three hour period is considered a rapid change
- The longer
it takes barometric pressure to change, the longer the coming weather
pattern can be expected to last
- It is possible that a small weather
event, such as a passing shower, may not trigger any change in
barometric pressure
- Compare barometric pressure starting
value with
behavior to make a
weather prediction:
| "Hg |
Rising or Steady |
Falling Slowly |
Falling Rapidly |
mb |
| > 30.20 |
Continued Fair |
Fair |
Cloudy, Warmer |
> 1022 |
|
29.80 to 30.20 |
Same as Present |
Little Change |
Precipitation Likely |
1009 to 1022 |
|
< 29.80 |
Clearing, Cooler |
Precipitation |
Storm |
<
1009 |
- Examples
- Continued Fair
- Fair
Cloudy, Warmer
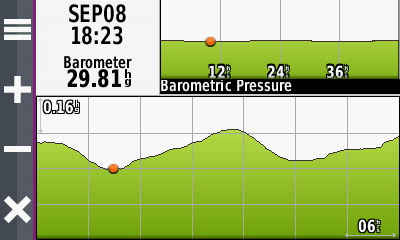
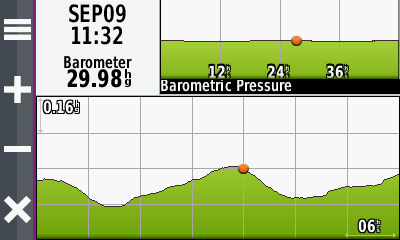
Same as Present - Steady Rise from 29.81"Hg to 29.98"Hg over 17 hours
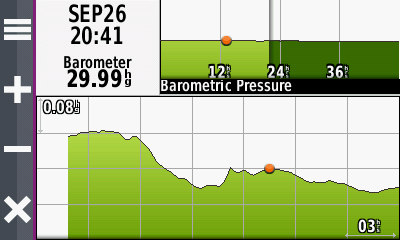
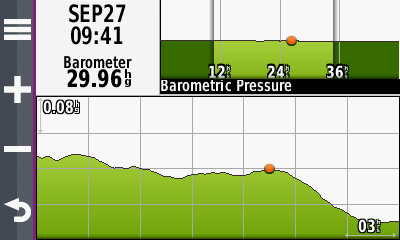
Little Change - Slowly Falling from 29.99"Hg to 29.96"Hg over 13 hours
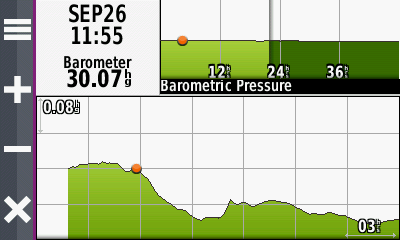
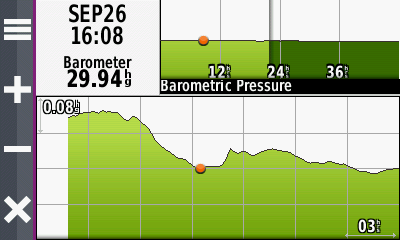
Precipitation Likely - Rapid Drop from 30.07"Hg to
29.94"Hg over 4 hours
Clearing, Cooler
Precipitation
Storm
7. Accuracy
- Garmin outdoor products are designed for recreational navigation
purposes, and are not intended for activities requiring precise
measurements.
- When calibrated properly, Garmin outdoor products can report
elevation values between -2,000 and 30,000 feet with +/-50 foot accuracy.
- The accuracy of the elevation values displayed and/or recorded can
and will be affected by multiple factors:
- Changes in Weather or Air Pressure
- Fluctuations in weather produce the most significant changes in air pressure.
- For example, when a storm is approaching, the sudden drop in air pressure may simulate the effects of moving to a higher elevation.
- Similarly, changes in air pressure occur when moving from indoors to outdoors and vice versa, particularly when moving in and out of climate-controlled buildings.
- Changes in Ambient Air Temperature
- Since barometric altimeters are not temperature-compensated, changes in ambient air temperature can affect altimeter accuracy.
- When significant changes in ambient temperature are experienced, the altimeter must be recalibrated to restore accuracy.
- Calibration Method
- For greatest accuracy, calibration should be performed using a known elevation,
such as a
Benchmark.
-
Calibration by GPS alone cannot guarantee accuracy within +/-50 feet.
- A clear view of the sky is essential to obtaining the most accurate
GPS based elevation possible.
8. Altitude vs. Elevation
- Many modern Garmin Outdoor Recreation navigators include an
Altimeter page.
- The only functions available on these devices remotely related to
Altitude are the following data fields:
- All remaining Altimeter page features are
directly related to:
- Elevation
- Ambient Pressure
- Barometric Pressure
- See Altitude vs. Elevation
for additional information.